Empirical Rule | Empirical Rule Definition
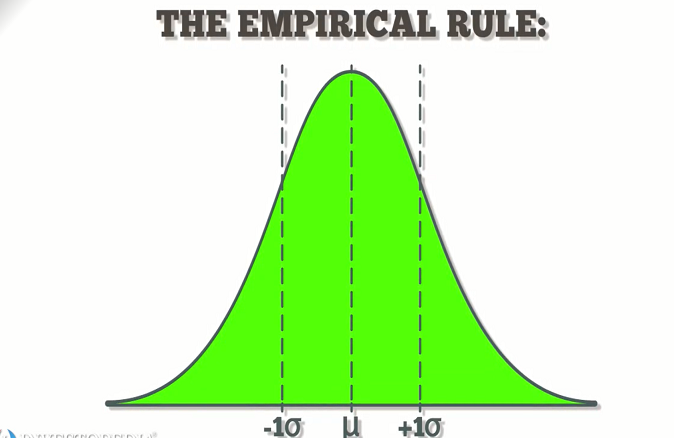
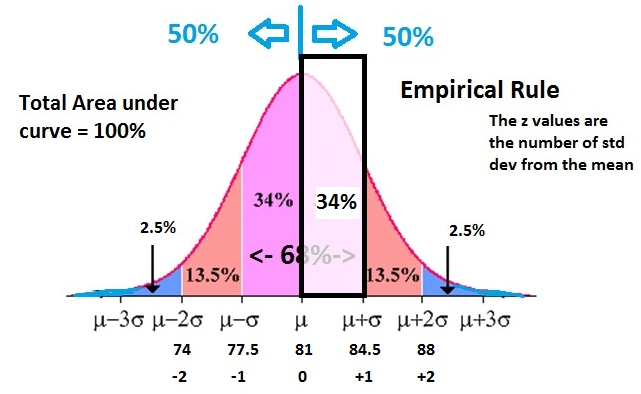
The empirical rule, also referred to as the three-sigma rule or 68-95-99.7 rule, is a statistical rule which states that for a normal distribution, almost all data falls within three standard deviations (denoted by σ) of the mean (denoted by µ).
Broken down, the empirical rule shows that 68% falls within the first standard deviation (µ ± σ), 95% within the first two standard deviations (µ ± 2σ), and 99.7% within the first three standard deviations (µ ± 3σ).
Empirical Rule Calculator
The empirical rule is often used in statistics for forecasting final outcomes. After calculating the standard deviation and before collecting exact data, this rule can be used as a rough estimate of the outcome of the impending data. This probability can be used in the interim since gathering appropriate data may be time-consuming or even impossible. The empirical rule is also used as a rough way to test a distribution’s “normality”. If too many data points fall outside the three standard deviation boundaries, this suggests that the distribution is not normal.
KEY TAKEAWAYS
- The Empirical Rule states that almost all data lies within 3 standard deviations of the mean for a normal distribution.
- Under this rule, 68% of the data falls within one standard deviation.
- Ninety-five percent of the data lies within two standard deviations.
- Within three standard deviations is 99.7% of the data.
Empirical Rule Formula | What is the formula for empirical rule?
Let’s assume a population of animals in a zoo is known to be normally distributed. Each animal lives to be 13.1 years old on average (mean), and the standard deviation of the lifespan is 1.5 years. If someone wants to know the probability that an animal will live longer than 14.6 years, they could use the empirical rule. Knowing the distribution’s mean is 13.1 years old, the following age ranges occur for each standard deviation:
- One standard deviation (µ ± σ): (13.1 – 1.5) to (13.1 + 1.5), or 11.6 to 14.6
- Two standard deviations (µ ± 2σ): 13.1 – (2 x 1.5) to 13.1 + (2 x 1.5), or 10.1 to 16.1
- Three standard deviations (µ ± 3σ): 13.1 – (3 x 1.5) to 13.1 + (3 x 1.5), or, 8.6 to 17.6
The person solving this problem needs to calculate the total probability of the animal living 14.6 years or longer. The empirical rule shows that 68% of the distribution lies within one standard deviation, in this case, from 11.6 to 14.6 years. Thus, the remaining 32% of the distribution lies outside this range. Half lies above 14.6 and half lies below 11.6. So, the probability of the animal living for more than 14.6 is 16% (calculated as 32% divided by two).
As another example, assume instead that an animal in the zoo lives to an average of 10 years of age, with a standard deviation of 1.4 years. Assume the zookeeper attempts to figure out the probability of an animal living for more than 7.2 years. This distribution looks as follows:
- One standard deviation (µ ± σ): 8.6 to 11.4 years
- Two standard deviations (µ ± 2σ): 7.2 to 12.8 years
- Three standard deviations ((µ ± 3σ): 5.8 to 14.2 years
The empirical rule states that 95% of the distribution lies within two standard deviations. Thus, 5% lies outside of two standard deviations; half above 12.8 years and half below 7.2 years. Thus, the probability of living for more than 7.2 years is:
95% + (5% / 2) = 97.5%
Empirical Rule Statistics
- Normal Distribution
- A specific type of symmetrical distribution, also known as a bell-shaped distribution
- Empirical Rule
- On a normal distribution about 68% of data will be within one standard deviation of the mean, about 95% will be within two standard deviations of the mean, and about 99.7% will be within three standard deviations of the mean
The normal curve showing the empirical rule. mean−2smean−1smean+1smean−3smean+3smeanmean+2s68%95%99.7%
- 95% Rule
- On a normal distribution approximately 95% of data will fall within two standard deviations of the mean; this is an abbreviated form of the Empirical Rule
The Empirical Rule | What Is The Empirical Rule
The Empirical Rule is often used in statistics for forecasting, especially when obtaining the right data is difficult or impossible to get. The rule can give you a rough estimate of what your data collection might look like if you were able to survey the entire population.
This rule applies generally to a random variable, X, following the shape of a normal distribution, or bell-curve, with a mean “mu” (the Greek letter &mu) and a standard deviation “sigma” (the Greek letter σ). The rule doesn’t apply to distributions that are not normal, but you can apply it to other distributions using Chebyshev’s Theorem.
Empirical Rule Example
Example: Pulse Rates
Suppose the pulse rates of 200 college men are bell-shaped with a mean of 72 and standard deviation of 6.
- About 68% of the men have pulse rates in the interval 72±1(6)=[66,78].
- About 95% of the men have pulse rates in the interval 72±2(6)=[60,84].
- About 99.7% of the men have pulse rates in the interval 72±3(6)=[54,90].
Example: IQ Scores
IQ scores are normally distributed with a mean of 100 and a standard deviation of 15.
- About 68% of individuals have IQ scores in the interval 100±1(15)=[85,115].
- About 95% of individuals have IQ scores in the interval 100±2(15)=[70,130].
- About 99.7% of individuals have IQ scores in the interval 100±3(15)=[55,145].
Statistics Empirical Rule
When applying the Empirical Rule to a data set the following conditions are true:
- Approximately 68% of the data falls within one standard deviation of the mean (or between the mean – one times the standard deviation, and the mean + 1 times the standard deviation). In mathematical notation, this is represented as: μ ± 1σ
- Approximately 95% of the data falls within two standard deviations of the mean (or between the mean – 2 times the standard deviation, and the mean + 2 times the standard deviation). The mathematical notation for this is: μ ± 2σ
- Approximately 99.7% of the data falls within three standard deviations of the mean (or between the mean – three times the standard deviation and the mean + three times the standard deviation). The following notation is used to represent this fact: μ ± 3σ
How To Use The Empirical Rule
The empirical rule states that for a normal distribution, nearly all of the data will fall within three standard deviations of the mean. The empirical rule can be broken down into three parts:
- 68% of data falls within the first standard deviation from the mean.
- 95% fall within two standard deviations.
- 99.7% fall within three standard deviations.
The rule is also called the 68-95-99 7 Rule or the Three Sigma Rule.